|
You'll find on this page the public version of the pChart library. Only major version are published here. If you
want to have access to the latest devel archive you'll need to be part of the early adopters community.
After downloading the archive, if you feel lost, please go to the documentation portal by clicking on the top right "Documentation" link.
Release Notes
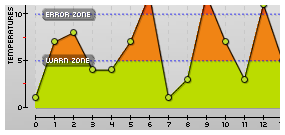
Added zone threshold support for filled area charts.
Added zone threshold support for filled spline charts.
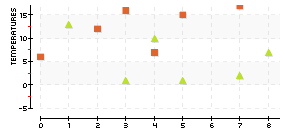
Added the setScatterSerieShape() function.
Added the getSerieMedian() function.
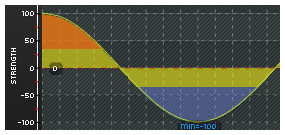
Added the drawZoneChart() function.
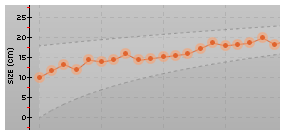
Added the getStandardDeviation() function.
Added the getCoefficientOfVariation() function.
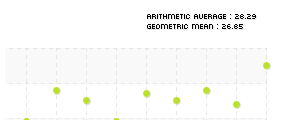
Added the getGeometricMean() function.
Added the getHarmonicMean() function.
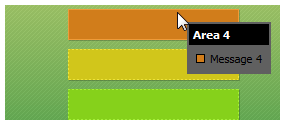
Introduced support for imageMap.
Added the initialiseImageMap() function.
Added the addToImageMap() function.
Added the dumpImageMap() function.
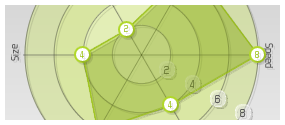
Added value writting supports to the radars & polars charts.
Added the option to add an inner border to the reg. and stacked bar charts.
Added the SERIE_SHAPE_DIAMOND and SERIE_SHAPE_FILLEDDIAMOND series shapes.
Fixed a visual bug in the drawAreaChart function. (thks to dmiller)
Added the BrowserExpire param to the stroke() function (thks to marquonis)
Fixed a visual bug in the drawBarChart function when the Interleave is 0.
Corrected a bug in the drawScatterBestFit() function (thks to ares)
Fixed some bugs with the pie chart functions.
Release Notes
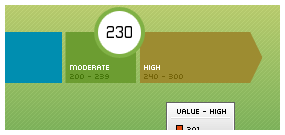
Created the pIndicator class.
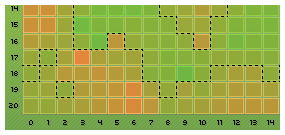
Created the pSurface class.
Added the drawLabel() function.
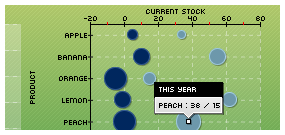
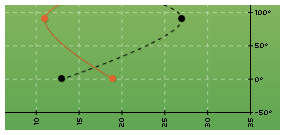
Added the writeScatterLabel() function.
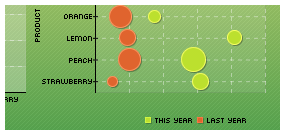
Added the writeBubbleLabel() function.
Added the ForceAlpha parameter to the buble chart.
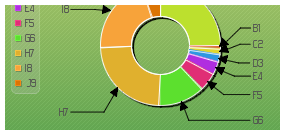
Added the LabelStacked parameter to the 2D and 3D pie charts.
Added 2D ring chart support to the pPie class extension.
Added 3D ring chart support to the pPie class extension.
Added the autoOutput() method to the pCache class.
Added some NULL value tests.
Added the setSerieShape() function to the pData class.
Added the setAbscissaName() function to the pData class.
Fixed a bug in the getAverage() function.
Changed the VOID constant from 0.12345 to 0.123456789.
Fixed a bug with the number of decimals in the METRIC scale.
Fixed a visual bug with reversed bar chart labelling.
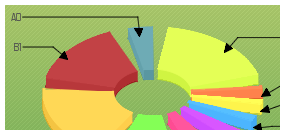
Added the ValuePosition & ValuePadding parameters to the pie charts.
Added the WriteValue parameters to the 2D pie charts.
Added the getSeriePalette() function to the pData class.
pData methods can now accept array of serie parameters.
Fixed a bug in the scatter spline chart VOID values handling.
The name of the class files has changed. This means that you'll have to update manually your current
scripts : include("class/pData.class"); will become : include("class/pData.class.php");
Release Notes
Renamed the .class files to .class.php.
Created the pScatter class.
Added a Forces config. array to drawSpline() function to allow parametric forces.
Added Floating0Serie, Floating0Value & Draw0Line options to the drawBarChart function.
Added support for line and filled step charts.
Fixed some visual artifact in the drawGradient(), drawRoundedFilledRectangle() and drawRadar() functions.
Rewritten the example index page.
Added the Floating parameter to the scaling functions.
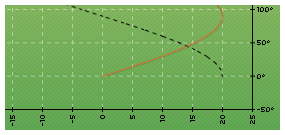
Added the drawBestFit() and drawScatterBestFit() math functions.
Additional Minor fixes.
Release Notes
Modified the drawScale() function to get the best visual factors.
Added the BorderAlpha parameter to the drawFilledCircle() function.
Shipped more examples.
Fixed a bug in the normalize() function and 0 Values.
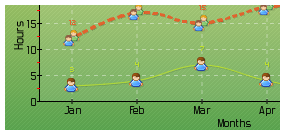
Finally implemented the setSeriePicture() output.
Added the bubble class extension.
Added the possibility to have a transparent background to the generated pictures keeping the alpha channels (thanks to georgi.m)
Updated the sandbox to support transparent background.
Added the drawDerivative() function to draw curve slope factor.
Additional Minor fixes.
Release Notes
Added missing points (VOID) handling for line & spline charts.
Added customisation options to the drawLegend() function.
Various additions and enhancements in the sandbox.
Added the weight series support to the drawSplineChart() function.
Added the SCALE_MODE_MANUAL scaling method.
Release Notes
Added the AxisBoxRounded, AxisFontName, AxisFontSize parameters to the radar and polar class.
Fixed a bug with the axis labels of the radar charts using the STAR layout.
Fixed a bug in the axis format computing.
Added the axis format option in the sandbox system.
Tuned the way the METRIC scales are displayed.
Fixed a bug with the getWidth(), getHeight().
|
|