|
You'll find on this page the public version of the pChart library. Only major version are published here. If you
want to have access to the latest devel archive you'll need to be part of the early adopters community.
After downloading the archive, if you feel lost, please go to the documentation portal by clicking on the top right "Documentation" link.
Release Notes
Updated drawPlotChart() to size the plot based on the serie weight.
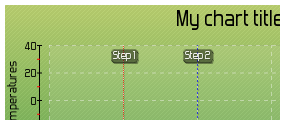
Added the drawXThreshold() function.
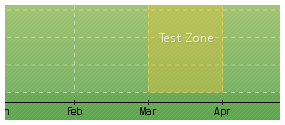
Added the drawXThresholdArea() function.
Added the AreaName param. to drawXThresholdArea() and drawThresholdArea().
Various visual enhancements.
Fixed a bug in the drawPlotChart() function.
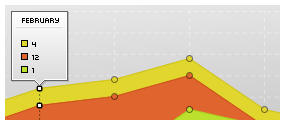
Added shadow support for the Area charts.
Added the BorderWidth parameter to the drawBubbleChart() function.
Added the Shape parameter to the drawBubbleChart() function.
Added the AXIS_FORMAT_CUSTOM for user callback handling.
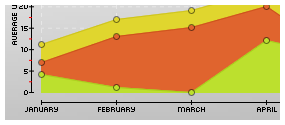
Rewritten the drawStackedAreaChart() function.
Added support for labels on stacked charts.
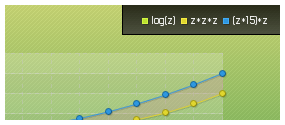
Added the createFunctionSerie() function to the pData class.
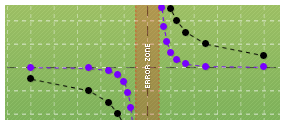
Added the drawScatterThreshold() function to the pScatter class.
Added the drawScatterThresholdArea() function to the pScatter class.
Added the setAbsicssaPosition() function to the pData class.
Added the NegateValues() function to the pData class.
Added the NoMargin parameter to the drawThresholdArea & drawThreshold fcts.
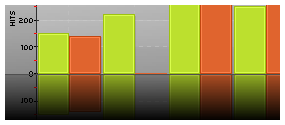
Added the drawAreaMirror() function.
Added the EURO_SYMBOL constant.
Added the replaceImageMapValues() function.
Added the replaceImageMapTitle() function.
Thresholds functions can now accept an array of points.
Added the FixedMax parameter to both the Radar and Polar charts.
Added the Precision parameter to the pie and ring charts.
Added the DisplayOrientation parameter to the bar & stacked bar charts.
Fixed a bug while using the drawBestFit function with VOID datasets.
Added the RemoveXAxis option to the drawScale() function.
|
|
