|
Prior to chart anything, it was mandatory to build a clear and extensive way to store the raw data.
This has been achieved through the pData classe that allows you to fully configure your series and
axis. Then some mathematical function have been added to allow simple statistical functionalities.
Easy to use syntax |
Object oriented interface
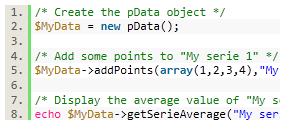
The pData class provides a data description interface allowing you to easily prepare the series you'll want
to chart. You can customize both the series (name, description, unit,... ) and the axis (name, position, scale,...).
Hundreds of parameters can be adjusted to get the desired rendering result.
See more in the documentation..
|
|
Scales customisations |
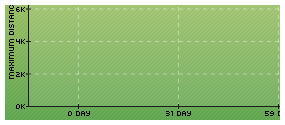
Scaling and units
You can attach an unit to each of your data series, define the way they are represented (numeric, time, currency, metric), skip
X labels,... Scale configuration is now really flexible and will allow you to provide clear data representation to your
users.
See more in the documentation..
|
|
Multiples scales |
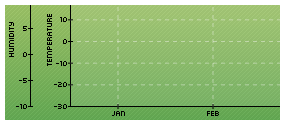
Multiple scales support
This concept was introduced in the first version of pChart. It has now been greatly extended and you create
as many Y axis as you want. Data can be splitted between each axis depending of the unit they use.
See more in the documentation..
|
|
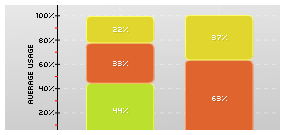
Inversion of the X/Y axis |
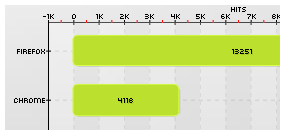
Axis inversion
Adapt the scale of your chart based on the data you want to present. You can now easily select where the
abscissa axis will be positioned and reverse your charts changing only one parameter.
See more in the documentation..
|
|
Datasets postprocessing |
Data manipulation
Data can be processed internally by the pData class to get the best eye-looking presentation
for your users.
See more in the documentation..
|
|
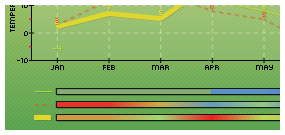
Slop analysis, visual output |
Slope computation
You can easily display and customize the slope factor of your data series. Such values can
highlight quick values variations.
See more in the documentation..
|
|
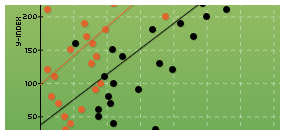
Computation of the line of best fit |
Line of best fit
pChart can compute automatically the line of best fit for your given data points. This feature
works on both X-Y and Y charts.
See more in the documentation..
|
|
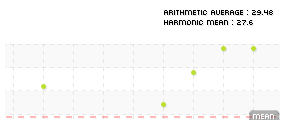
Computation of statistical data |
Means & Deviation computing
pChart offers various inbuilt function to automatically compute scores from your datasets. It
is easy to get the geometric, harmonic mean, the median value or even the coefficient of variation.
See more in the documentation..
|
|
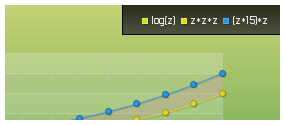
Mathematical functions computing |
Functions computing
You can compute mathematical functions and affect the result to your dataset before charting it.
See more in the documentation..
|
|
|
|